
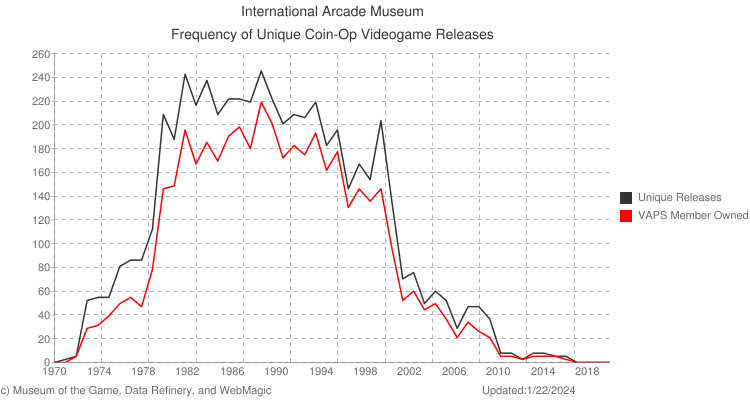
Frequency of Coin-Op Videogame Releases
Comparison of UNIQUE Titles Released vs. UNIQUE Titles owned by VAPS Members.
Notice the two graphs match surprising well. Also note that the videogame crash of 1983 didn't really affect the number of games released. Innovation didn't strive nearly as well through the economic slowdown following the dot-com/Nasdaq crash that began it's net decline on March 10, 2000, the March 2000 release of the Playstation 2, and the November 15, 2001 North American release of the xBox. Interestingly, there is a fairly consistent level of correlation over the years between the number of individual titles issued by manufacturers, and the percentage of those releases that can be found in the collection of our VAPS (Video & Arcade Preservation Society) members.
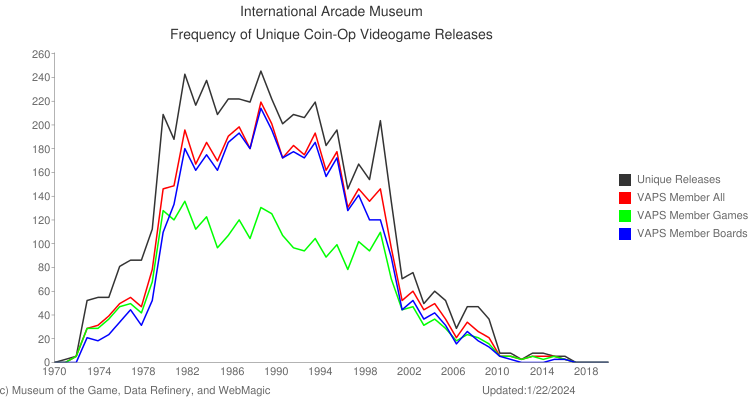
Frequency of Coin-Op Videogame Releases
Comparison of UNIQUE Titles Released vs. UNIQUE Titles owned by VAPS Members.
This is the same graph as above, but with a couple extra lines. The red line includes all member owned videogame titles, including both whole games and board sets. The green line includes just whole cabinets, with the blue line represents board sets. From the mid-1980s on, members are much more likely to have a board set to go to a game rather than a game itself. This is likely due to a number of reasons, including the allure of earlier game cabinets from the golden era, the shear number of games from the early 80s that have survived, and the rise of conversion game kits sold without cabinets as the 1980s progressed.
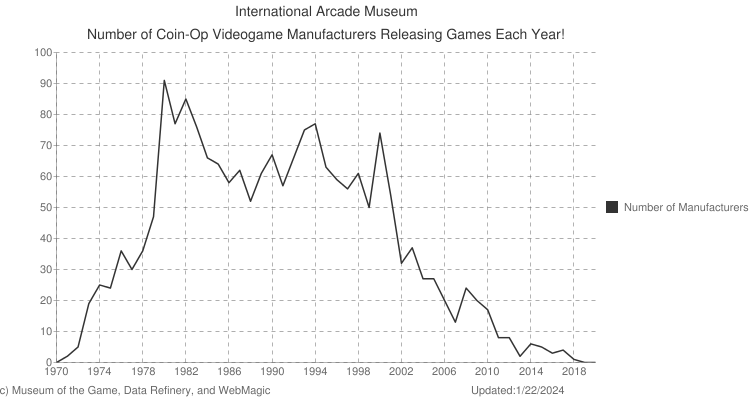
Number of Videogame Manufacturers in Business Each Year
Another reflection on the health of an industry during its boom and bust years.
This graph shows the number of manufacturers who released a game in each year from 1971 on.
Number of Videogame Releases by Each Manufacturers Each Year
This table only considers manufacturers with at least one release in any given year.
This graph is actually more stable than one might have anticipated. During boom years, more companies entered the business but the average number of releases per company hasn't varied much. To some extent during the 1979-1982 boom the average actually went down as new manufacturers came out with releases faster than existing manufacturers expanded development. With the crash in 1983 the average began to creep up as smaller companies exited the scene.
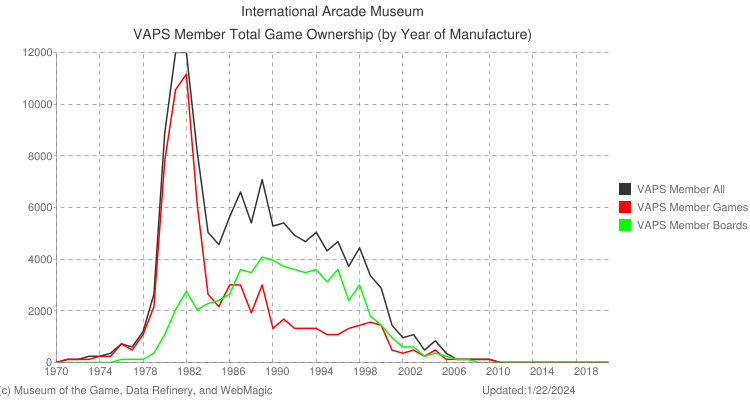
Frequency of Games Owned by VAPS Members
A comparison of TOTAL NUMBERS of games owned by VAPS Members.
In the first graph, we saw that the videogame crash of 1983 didn't bring a drop in the number of games being released. A natural question though, is how well did those games sell? This graph can provide a clue. While this graph is slightly skewed in that it measures games saved by collectors as opposed to games manufactured, we still believe it is generally accurate as to the later question, especially in regards to games at least 10 years old. Total number of games owned by members spikes greatly beginning with the 1979 release year. Then by 1983, production dropped greatly and never returned even though the same general number of new releases continued be issued for many subsequent years.
It is to be noted that although the total number of games held by members (#s except for recentt released likely related to production) shows a decline in the mid-1980s, the number of circuit boards saved increases. This is likely due to the introduction of the JAMMA wiring standard in 1985. With it, a circuit board saved from one game could be easily placed in nearly any other compatible cabinet
Data is live and current as of February 5, 2025, 5:59 pm